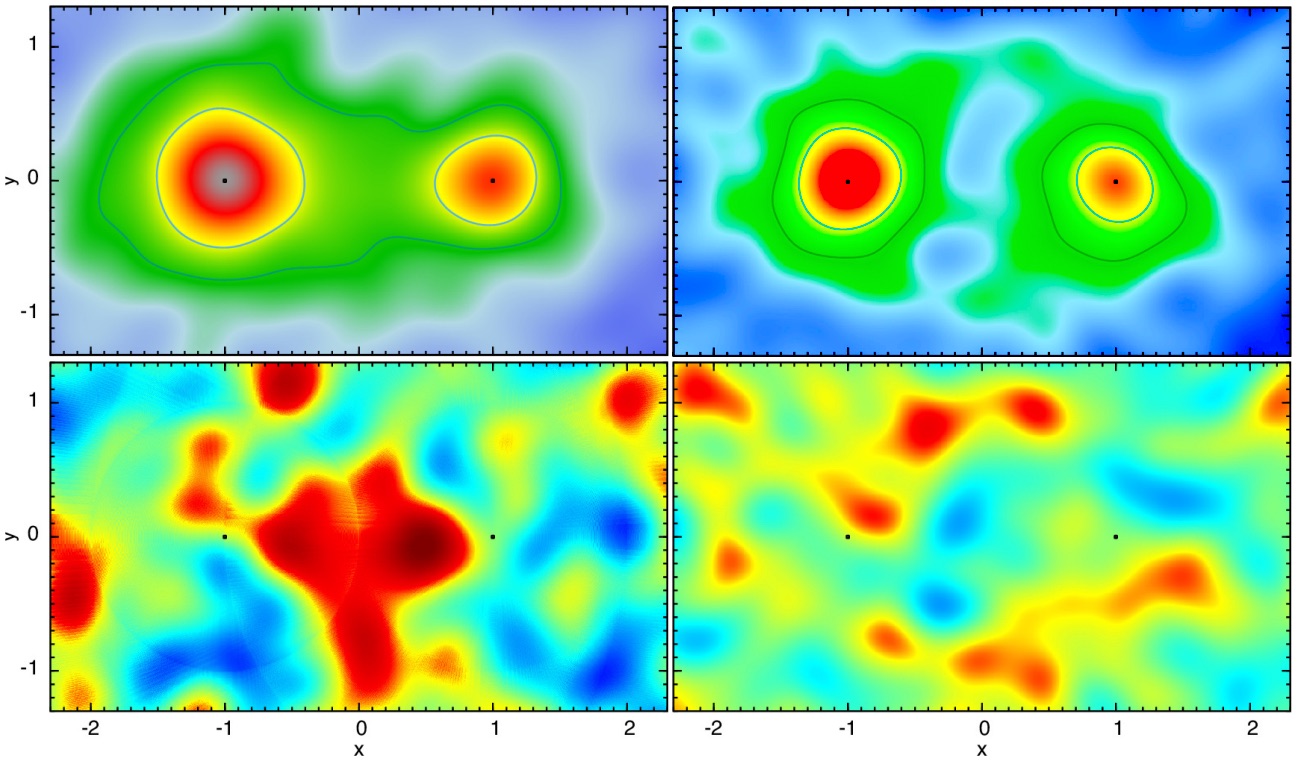
Libeskind et al. (2016) find that when you look around a close-ish pair of galaxies, you’ll find that their satellites are clumped in the space between them. I’d like to determine how large a sample I’ll need to observe this effect in another dataset and figure out how good photoZs need to be to do this with a sample of pairs selected without specZs.
Lopsided Satellite Distributions
Libeskind et al. (2016) find that when you look around a close-ish pair of galaxies, you’ll find that their satellites are clumped in the space between them.
I’d like to determine how large a sample I’ll need to observe this effect in another dataset and figure out how good photoZs need to be to do this with a sample of pairs selected without specZs. We’ll run a CASjobs query to select pairs of host galaxies that meet the pair criteria used by Libeskind et al. (2016), namely: * host magnitude: -23.5 < Mr < -21.5 * host separation 0.5 < dSep[Mpc] < 1.0 * magnitude difference of pair < 1 mag * spectroscopic redshift difference < 0.003
This query will do the job:
SELECT specObjId, objId, z, zerr, ra, dec, cModelMag_r,
       specObjId2, objId2, z2, zerr2, ra2, dec2, cModelMag_r2,
       dbo.fDistanceArcMinEq(P.ra,P.dec,S.ra2,S.dec2)*0.000290888
               *dbo.fCosmoDa(P.z,DEFAULT,DEFAULT,DEFAULT,DEFAULT,DEFAULT) as sepPhysicalMpc
 into mydb.PairsDR12NoNeighborsv2_0_50__25_36specphoto
FROM
(
 SELECT specObjId,objId,z,zerr,ra,dec,cModelMag_r
  FROM SpecPhoto
  WHERE class='GALAXY' and
        z between 0 and 0.2 and
        ra between 0 and 50 and
        dec between -25 and 36 and
        cModelMag_r is not null and
        dbo.fCosmoAbsMag(cModelMag_r,z,DEFAULT,DEFAULT,DEFAULT,DEFAULT,DEFAULT) between -23.5 and -21.5
) as P        -- P for primary, the brighter of the galaxies in the pair
 JOIN
(
 SELECT specObjId as specObjId2, objId as objId2, z as z2, zerr as zErr2,
        ra as ra2, dec as dec2, cModelMag_r as cModelMag_r2
  FROM SpecPhoto
  WHERE class='GALAXY' and
        z between 0 and 0.203 and
        ra between -1 and 51 and
        dec between-27 and 37 and
        cModelMag_r is not null and
        dbo.fCosmoAbsMag(cModelMag_r,z,DEFAULT,DEFAULT,DEFAULT,DEFAULT,DEFAULT) between -23.5 and -20.5
) as S         -- S for secondary, the fainter of the galaxies in the pair

 ON abs(P.z - S.z2) < 0.003
 WHERE S.cModelMag_r2-P.cModelMag_r between 0. and 1. and
       P.SpecObjId!=S.SpecObjID2  and
       dbo.fDistanceArcMinEq(P.ra,P.dec,S.ra2,S.dec2) between
            (0.5/dbo.fCosmoDa(P.z,DEFAULT,DEFAULT,DEFAULT,DEFAULT,DEFAULT))*3437.75 and
            (1./dbo.fCosmoDa(P.z,DEFAULT,DEFAULT,DEFAULT,DEFAULT,DEFAULT))*3437.75
This sample we’ve selected includes pairs of galaxies that might belong to a bigger structure. Running a group finder and starting from a sample of 2-galaxy halos would give us the purest sample, but we can do alright by eliminating any pair in the sample that includes a galaxy that shows up more than once as either a primary or secondary pair member with this query:
SELECT *
into mydb.uniquePairsDR12NoNeighborsv2_0_50__25_36specphoto FROM
(
 SELECT * FROM
  (SELECT * FROM PairsDR12NoNeighborsv2_0_50__25_36specphoto) as A

  JOIN

(SELECT s, count(*) as count1 FROM
  (SELECT SpecObjId as s from myDB.realPairsDR12NoNeighborsv2_0_50__25_36specphoto
    UNION ALL
    SELECT SpecObjId2 as s from myDB.realPairsDR12NoNeighborsv2_0_50__25_36specphoto) as combCount
  GROUP BY s) as B

  on B.s = A.SpecObjId
 WHERE count1=1 ) as C

 JOIN

(SELECT s2,count(*) as count2 FROM
  (SELECT SpecObjId as s2 FROM myDB.realPairsDR12NoNeighborsv2_0_50__25_36specphoto
   UNION ALL
  SELECT SpecObjId2 as s2 FROM myDB.realPairsDR12NoNeighborsv2_0_50__25_36specphoto) as combCount
  GROUP BY s2) as D
  ON D.s2 = C.SpecObjId2
 WHERE count2=1
Now we have a sample of unique pairs of galaxies meeting the pair criteria (no galaxy is a part of more than one pair.) We can now look for the satellites of the objects in each pair. We’ll use the GalaxyTag view and Photoz table to get position and redshift information for each potential satellite and select objects within 250 kpc of each host. Calculating all these distances is an expensive operation so it’ll be necessary to divide this query into chunks that can be completed within the maximum query time.
We’ll then transform their coordinates to get their positions relative to the line connecting the host pair. We’ll create separate tables for the primary and secondary hosts of each pair.
"""
                      .-.
                 .--.(   ).--.
      <-.  .-.-.(.->          )_  .--.
       `-`(     )-'             `)    )
         (o  o  )                `)`-'
        (      )                ,)
        ( ()  )                 )
         `---"\    ,    ,    ,/`
               `--' `--' `--'
                |  |   |   |
                |  |   |   |
                '  |   '   |     AnneyA
"""
from __future__ import print_function, division
import numpy as np
from astropy import units as u
import matplotlib.pyplot as plt
from matplotlib import patches
from astropy.cosmology import WMAP9 as cosmo
from sklearn.neighbors import BallTree
import pandas as pd
pd.set_option('display.max_rows', 10)
from SciServer import CasJobs
from SciServer import LoginPortal
from io import StringIO
import urllib
plt.rc('font',family='serif')
# get access token
my_access_token = LoginPortal.getToken()

# get satellite data from CasJobs
#query_text = "SELECT * from rasalhague.anneya.satellites0_50__25_36DR11"
query_text = "SELECT * from mydb.satellites10_20__0_10DR11"
response = CasJobs.executeQuery(query_text, "mydb", token = my_access_token)
output = StringIO(response.read())

# put the query output in a pandas dataframe
sats1 = pd.read_csv(output)
sats1
| specObjId | objId | z | zerr | ra | dec | cModelMag_r | specObjId2 | objId2 | z2 | zerr2 | ra2 | dec2 | cModelMag_r2 | sepPhysicalMpc | satObjId | satRa | satDec | d0 | |
|---|---|---|---|---|---|---|---|---|---|---|---|---|---|---|---|---|---|---|---|
| 0 | 444883600110807040 | 1237663784203976830 | 0.110170 | 0.000023 | 15.035608 | 0.10439 | 17.01925 | 445951776210839552 | 1237666339188310081 | 0.109288 | 0.000029 | 15.026402 | -0.025662 | 17.05519 | 0.942928 | 1237663784203977141 | 15.004072 | 0.104298 | 0.228078 |
| 1 | 444883600110807040 | 1237663784203976830 | 0.110170 | 0.000023 | 15.035608 | 0.10439 | 17.01925 | 445951776210839552 | 1237666339188310081 | 0.109288 | 0.000029 | 15.026402 | -0.025662 | 17.05519 | 0.942928 | 1237663784203977140 | 15.004366 | 0.094372 | 0.237282 |
| 2 | 444883600110807040 | 1237663784203976830 | 0.110170 | 0.000023 | 15.035608 | 0.10439 | 17.01925 | 445951776210839552 | 1237666339188310081 | 0.109288 | 0.000029 | 15.026402 | -0.025662 | 17.05519 | 0.942928 | 1237663784203976881 | 15.004958 | 0.099941 | 0.223995 |
| 3 | 444883600110807040 | 1237663784203976830 | 0.110170 | 0.000023 | 15.035608 | 0.10439 | 17.01925 | 445951776210839552 | 1237666339188310081 | 0.109288 | 0.000029 | 15.026402 | -0.025662 | 17.05519 | 0.942928 | 1237663784203977646 | 15.005541 | 0.106520 | 0.217997 |
| 4 | 444883600110807040 | 1237663784203976830 | 0.110170 | 0.000023 | 15.035608 | 0.10439 | 17.01925 | 445951776210839552 | 1237666339188310081 | 0.109288 | 0.000029 | 15.026402 | -0.025662 | 17.05519 | 0.942928 | 1237663784203977148 | 15.006277 | 0.103348 | 0.212263 |
| ... | ... | ... | ... | ... | ... | ... | ... | ... | ... | ... | ... | ... | ... | ... | ... | ... | ... | ... | ... |
| 6639 | 1685610197671766016 | 1237663784740716774 | 0.187626 | 0.000009 | 14.796079 | 0.44305 | 18.03054 | 1219487904976365568 | 1237666339725050070 | 0.188833 | 0.000008 | 14.832151 | 0.371350 | 18.80173 | 0.907881 | 1237663784740717670 | 14.808726 | 0.442745 | 0.143093 |
| 6640 | 1685610197671766016 | 1237663784740716774 | 0.187626 | 0.000009 | 14.796079 | 0.44305 | 18.03054 | 1219487904976365568 | 1237666339725050070 | 0.188833 | 0.000008 | 14.832151 | 0.371350 | 18.80173 | 0.907881 | 1237663784740717681 | 14.812851 | 0.438051 | 0.197961 |
| 6641 | 1685610197671766016 | 1237663784740716774 | 0.187626 | 0.000009 | 14.796079 | 0.44305 | 18.03054 | 1219487904976365568 | 1237666339725050070 | 0.188833 | 0.000008 | 14.832151 | 0.371350 | 18.80173 | 0.907881 | 1237663784740717686 | 14.814525 | 0.434202 | 0.231407 |
| 6642 | 1685610197671766016 | 1237663784740716774 | 0.187626 | 0.000009 | 14.796079 | 0.44305 | 18.03054 | 1219487904976365568 | 1237666339725050070 | 0.188833 | 0.000008 | 14.832151 | 0.371350 | 18.80173 | 0.907881 | 1237663784740717432 | 14.815718 | 0.441924 | 0.222503 |
| 6643 | 1685610197671766016 | 1237663784740716774 | 0.187626 | 0.000009 | 14.796079 | 0.44305 | 18.03054 | 1219487904976365568 | 1237666339725050070 | 0.188833 | 0.000008 | 14.832151 | 0.371350 | 18.80173 | 0.907881 | 1237663784740717812 | 14.816672 | 0.446975 | 0.237118 |
6644 rows × 19 columns
# Since the satellite query was run in patches, get more or them with another call to mydb
#query_text = "SELECT * from rasalhague.anneya.satellites0_50__25_36DR11"
query_text = "SELECT * from mydb.satellites0_10__0_10DR11"
response = CasJobs.executeQuery(query_text, "mydb", token = my_access_token)
output = StringIO(response.read())

# put the query output in a pandas dataframe
sats2 = pd.read_csv(output)
sats = sats1.append(sats2,ignore_index=True)
sats
| specObjId | objId | z | zerr | ra | dec | cModelMag_r | specObjId2 | objId2 | z2 | zerr2 | ra2 | dec2 | cModelMag_r2 | sepPhysicalMpc | satObjId | satRa | satDec | d0 | |
|---|---|---|---|---|---|---|---|---|---|---|---|---|---|---|---|---|---|---|---|
| 0 | 444883600110807040 | 1237663784203976830 | 0.110170 | 0.000023 | 15.035608 | 0.104390 | 17.01925 | 445951776210839552 | 1237666339188310081 | 0.109288 | 0.000029 | 15.026402 | -0.025662 | 17.05519 | 0.942928 | 1237663784203977141 | 15.004072 | 0.104298 | 0.228078 |
| 1 | 444883600110807040 | 1237663784203976830 | 0.110170 | 0.000023 | 15.035608 | 0.104390 | 17.01925 | 445951776210839552 | 1237666339188310081 | 0.109288 | 0.000029 | 15.026402 | -0.025662 | 17.05519 | 0.942928 | 1237663784203977140 | 15.004366 | 0.094372 | 0.237282 |
| 2 | 444883600110807040 | 1237663784203976830 | 0.110170 | 0.000023 | 15.035608 | 0.104390 | 17.01925 | 445951776210839552 | 1237666339188310081 | 0.109288 | 0.000029 | 15.026402 | -0.025662 | 17.05519 | 0.942928 | 1237663784203976881 | 15.004958 | 0.099941 | 0.223995 |
| 3 | 444883600110807040 | 1237663784203976830 | 0.110170 | 0.000023 | 15.035608 | 0.104390 | 17.01925 | 445951776210839552 | 1237666339188310081 | 0.109288 | 0.000029 | 15.026402 | -0.025662 | 17.05519 | 0.942928 | 1237663784203977646 | 15.005541 | 0.106520 | 0.217997 |
| 4 | 444883600110807040 | 1237663784203976830 | 0.110170 | 0.000023 | 15.035608 | 0.104390 | 17.01925 | 445951776210839552 | 1237666339188310081 | 0.109288 | 0.000029 | 15.026402 | -0.025662 | 17.05519 | 0.942928 | 1237663784203977148 | 15.006277 | 0.103348 | 0.212263 |
| ... | ... | ... | ... | ... | ... | ... | ... | ... | ... | ... | ... | ... | ... | ... | ... | ... | ... | ... | ... |
| 16366 | 1737398584023738368 | 1237663716017438950 | 0.193247 | 0.000018 | 7.168378 | 0.444263 | 18.37083 | 1737399683535366144 | 1237663716017504520 | 0.192621 | 0.000025 | 7.219909 | 0.483397 | 18.48269 | 0.749309 | 1237663716017504699 | 7.183934 | 0.458505 | 0.244236 |
| 16367 | 1737398584023738368 | 1237663716017438950 | 0.193247 | 0.000018 | 7.168378 | 0.444263 | 18.37083 | 1737399683535366144 | 1237663716017504520 | 0.192621 | 0.000025 | 7.219909 | 0.483397 | 18.48269 | 0.749309 | 1237663716017505251 | 7.184719 | 0.444490 | 0.189253 |
| 16368 | 1737398584023738368 | 1237663716017438950 | 0.193247 | 0.000018 | 7.168378 | 0.444263 | 18.37083 | 1737399683535366144 | 1237663716017504520 | 0.192621 | 0.000025 | 7.219909 | 0.483397 | 18.48269 | 0.749309 | 1237663716017505491 | 7.187358 | 0.444616 | 0.219822 |
| 16369 | 1737398584023738368 | 1237663716017438950 | 0.193247 | 0.000018 | 7.168378 | 0.444263 | 18.37083 | 1737399683535366144 | 1237663716017504520 | 0.192621 | 0.000025 | 7.219909 | 0.483397 | 18.48269 | 0.749309 | 1237663716017505492 | 7.187483 | 0.451385 | 0.236109 |
| 16370 | 1737398584023738368 | 1237663716017438950 | 0.193247 | 0.000018 | 7.168378 | 0.444263 | 18.37083 | 1737399683535366144 | 1237663716017504520 | 0.192621 | 0.000025 | 7.219909 | 0.483397 | 18.48269 | 0.749309 | 1237663716017504500 | 7.189092 | 0.446392 | 0.241133 |
16371 rows × 19 columns
# Get the unique host pairs too
query_text = "select * from rasalhague.anneya.uniquePairsDR12NoNeighborsv2_0_50__25_36specphoto "+\
             "where ra between 0 and 20 and dec between 0 and 10"
response = CasJobs.executeQuery(query_text, "mydb", token = my_access_token)
output = StringIO(response.read())
pairs = pd.read_csv(output)
pairs
| specObjId | objId | z | zerr | ra | dec | cModelMag_r | specObjId2 | objId2 | z2 | zerr2 | ra2 | dec2 | cModelMag_r2 | sepPhysicalMpc | s | count1 | s2 | count2 | |
|---|---|---|---|---|---|---|---|---|---|---|---|---|---|---|---|---|---|---|---|
| 0 | 444883600110807040 | 1237663784203976830 | 0.110170 | 0.000023 | 15.035608 | 0.104390 | 17.01925 | 445951776210839552 | 1237666339188310081 | 0.109288 | 0.000029 | 15.026402 | -0.025662 | 17.05519 | 0.942928 | 444883600110807040 | 1 | 445951776210839552 | 1 |
| 1 | 779216505828042752 | 1237663784739668171 | 0.132400 | 0.000027 | 12.359886 | 0.496592 | 17.42955 | 778156576585312256 | 1237663784739668202 | 0.132801 | 0.000035 | 12.312457 | 0.457162 | 17.60771 | 0.522924 | 779216505828042752 | 1 | 778156576585312256 | 1 |
| 2 | 779222828019902464 | 1237666340797874359 | 0.137143 | 0.000039 | 12.750498 | 1.185658 | 17.53605 | 1220599512423229440 | 1237666340797874288 | 0.136790 | 0.000042 | 12.679050 | 1.139000 | 17.66920 | 0.745362 | 779222828019902464 | 1 | 1220599512423229440 | 1 |
| 3 | 436953647541151744 | 1237663278465155352 | 0.094867 | 0.000008 | 1.242556 | 0.980047 | 16.56688 | 772460561966327808 | 1237663278465155357 | 0.095111 | 0.000022 | 1.249490 | 0.842499 | 17.07640 | 0.872652 | 436953647541151744 | 1 | 772460561966327808 | 1 |
| 4 | 438146617690843136 | 1237663784199520495 | 0.063957 | 0.000015 | 4.895507 | 0.200582 | 15.34856 | 774715655013296128 | 1237657191444185240 | 0.062766 | 0.000010 | 4.812110 | 0.289421 | 16.20651 | 0.539300 | 438146617690843136 | 1 | 774715655013296128 | 1 |
| ... | ... | ... | ... | ... | ... | ... | ... | ... | ... | ... | ... | ... | ... | ... | ... | ... | ... | ... | ... |
| 233 | 1225105041866647552 | 1237663278466924652 | 0.142192 | 0.000028 | 5.252280 | 0.877320 | 17.30590 | 1679968054525585408 | 1237657191981252773 | 0.143190 | 0.000007 | 5.279819 | 0.810610 | 18.27884 | 0.650048 | 1225105041866647552 | 1 | 1679968054525585408 | 1 |
| 234 | 1225115212349204480 | 1237663784199716989 | 0.158824 | 0.000011 | 5.268229 | 0.046061 | 17.74778 | 774695314048182272 | 1237657190907510865 | 0.158262 | 0.000006 | 5.234068 | -0.020846 | 18.37702 | 0.742118 | 1225115212349204480 | 1 | 774695314048182272 | 1 |
| 235 | 1685610197671766016 | 1237663784740716774 | 0.187626 | 0.000009 | 14.796079 | 0.443050 | 18.03054 | 1219487904976365568 | 1237666339725050070 | 0.188833 | 0.000008 | 14.832151 | 0.371350 | 18.80173 | 0.907881 | 1685610197671766016 | 1 | 1219487904976365568 | 1 |
| 236 | 1736232276997466112 | 1237663784199192920 | 0.139499 | 0.000029 | 4.175864 | 0.066316 | 17.55368 | 1735163001905899520 | 1237663784199192868 | 0.139257 | 0.000022 | 4.153729 | 0.176792 | 18.07148 | 0.998608 | 1736232276997466112 | 1 | 1735163001905899520 | 1 |
| 237 | 1737398584023738368 | 1237663716017438950 | 0.193247 | 0.000018 | 7.168378 | 0.444263 | 18.37083 | 1737399683535366144 | 1237663716017504520 | 0.192621 | 0.000025 | 7.219909 | 0.483397 | 18.48269 | 0.749309 | 1737398584023738368 | 1 | 1737399683535366144 | 1 |
238 rows × 19 columns
# Plot the pair hosts and the satellites of the primaries
plt.scatter(sats['satRa'], sats['satDec'], s=14, color='0.75', alpha=0.75, label='Satellites')
plt.scatter(sats['ra'], sats['dec'], s=8, color='red', label='Primary Hosts')
plt.scatter(sats['ra2'], sats['dec2'], s=8, color='black',  label='Secondary Hosts')

# Plot a line connecting each pair
for p in pairs.itertuples():
    plt.plot([p.ra,p.ra2],[p.dec,p.dec2],color='black',lw=1)

plt.gca().set_aspect('equal')
plt.xlim(0,20), plt.ylim(0,10)
plt.xlabel('ra'), plt.ylabel('dec')
plt.legend(scatterpoints=1, loc='upper right', fontsize=12, \
          fancybox=True, shadow=True)
plt.gcf().set_size_inches(15,15)
plt.grid()

The dataframe now contains every satellite of the primary host of each galaxy pair. We need to transform their coordinates to determine their angle relative to the line connecting the pair.
# Add new coordinates for each satellite, moving the origin to the position of the primary host
sats['shiftRa'] = pd.Series(sats['satRa']-sats['ra'], index=sats.index)
sats['shiftDec'] = pd.Series(sats['satDec']-sats['dec'], index=sats.index)

# Rotate the x-axis to lie on the line connecting the host pair
sats['rotTheta'] = pd.Series(-1.*np.arctan2((sats['dec2']-sats['dec']),(sats['ra2']-sats['ra'])),index=sats.index)
sats['rotRa'] = np.cos(sats['rotTheta'])*sats['shiftRa'] - np.sin(sats['rotTheta'])*sats['shiftDec']
sats['rotDec'] = np.sin(sats['rotTheta'])*sats['shiftRa'] + np.cos(sats['rotTheta'])*sats['shiftDec']

# Calculate angle of each satellite relative to pair
sats['theta'] = pd.Series(np.arctan2(sats['rotDec'],sats['rotRa'])*180./np.pi,index=sats.index)

# Add position of each satellite relative to the host in physical units
sats['xPhys'] = pd.Series(sats['d0']*np.cos(sats['theta']), index=sats.index)
sats['yPhys'] = pd.Series(sats['d0']*np.sin(sats['theta']), index=sats.index)
sats['thetabs'] = pd.Series(np.abs(sats['theta']),index=sats.index)
pd.unique(sats[np.abs(sats['rotTheta']-0.5)<0.1]['objId'])
array([1237663784201748659, 1237669703199883407, 1237678661965906002,
       1237663204919541845, 1237657192518451345, 1237669516368085111,
       1237678662497796189, 1237669516906987707])
We can check that the transformation is working as expected:
testPair = sats[sats['objId']==pairs['objId'][1]]
#plt.scatter(testPair['shiftRa'],testPair['shiftDec'],color='blue',alpha=0.3,s=30,\
#            label='Satellite positions before rotation')
plt.scatter(testPair['rotRa'],testPair['rotDec'],color='red',alpha=0.5,s=75,marker='*',\
            label='Satellite positions after rotation')

plt.scatter([0],[0],color='0.4',s=60)
plt.scatter(testPair['ra2']-testPair['ra'],testPair['dec2']-testPair['dec'],color='0.4',s=60)
sep = np.array(np.sqrt((testPair['ra2']-testPair['ra'])**2+(testPair['dec2']-testPair['dec'])**2))
plt.scatter([sep],0.*testPair['ra2'],\
            color='0.4',s=60,label=None)
rotAngle = 1.0*np.array(testPair['rotTheta'])[0]
if rotAngle<0:
    t1 = 0.
    t2 = np.abs(rotAngle)
else:
    t1 = 2*np.pi-rotAngle
    t2 = 0.

print(rotAngle*180/np.pi)

el = patches.Arc((0,0), 2*sep[0],2*sep[0], angle=0.0, theta2=180.*t2/np.pi, theta1=180.*t1/np.pi,lw=3,\
                 color='0.6',alpha=0.66)
plt.grid()
plt.gca().add_patch(el)

ps = []
for p in testPair.itertuples():
    sep = np.sqrt(p.shiftRa**2 + p.shiftDec**2)
    myTheta = np.arctan2(p.shiftDec,p.shiftRa)
    if myTheta<0:
        myTheta = 2*np.pi + myTheta
    if rotAngle<0:
        t2 = myTheta
        t1 = myTheta + rotAngle
    else:
        t1 = myTheta
        t2 = myTheta + rotAngle
    ps.append(patches.Arc((0,0), 2*sep,2*sep, angle=0.0,theta2=180.*t2/np.pi, theta1=180.*t1/np.pi ,\
                          lw=2,color='purple',alpha=0.3))
for p in ps:
    plt.gca().add_patch(p)
plt.gca().set_aspect('equal')
plt.gcf().set_size_inches(15,15)
plt.legend(loc='best',scatterpoints=1)
